Event Registration Metrics for Corporate Events

Useful event registration metrics show how people move from invitation or page visit to a confirmed place. Track responses, confirmed headcount, outstanding invitations and registration timing before the event. Measure actual attendance separately afterwards, and connect business outcomes only when you have evidence for them.
This guide defines practical metrics for company events, customer seminars and business conferences. The formulas are reporting definitions you can adopt consistently; they are not universal labels that every platform calculates in the same way.
On this page
Define the question before choosing the metric
| Metric | Definition | Fictional example |
|---|---|---|
| Response rate | Eligible invitee responses / primary invitees × 100 | 160 / 200 = 80% |
| Yes rate | Primary yes responses / primary invitees × 100 | 120 / 200 = 60% |
| Confirmed headcount | Confirmed primary attendees + confirmed companions | 120 + 18 = 138 people |
| Outstanding invitations | Primary invitees without the required response | 40 primary invitees |
| Registrations per session | Completed registrations / eligible page sessions × 100 | 90 / 600 = 15% |
| Capacity utilisation | Confirmed people counted against capacity / available attendee places × 100 | 138 / 150 = 92% |
| Attendance rate | Observed arrivals / confirmed expected people at a defined cutoff × 100 | 124 / 138 ≈ 89.9% |
These examples illustrate separate reporting questions; they are not an industry benchmark dataset. Use a consistent population and reporting window, and verify arrival data before reporting attendance.
An HR team may need a dependable catering count. A marketing team may need to know whether the intended audience registered. A sponsor may ask about event reach. Those are different questions and cannot be answered by one headline total.
Write the decision beside each metric. “Outstanding invitations” tells you whether to follow up. “Confirmed headcount including companions” supports logistics. “Observed attendance” helps assess how many confirmed people arrived.
Use the same definitions across reports and periods. A change in formula can look like a change in performance even when attendee behaviour is unchanged.
Response rate for invited events
Response rate = invitees who submitted an eligible response divided by invited people, multiplied by 100.
Define eligible responses. You might count yes and no, while reporting maybe separately. If you count maybe as a response, state that choice. Exclude companions from the invitee denominator when they did not receive separate invitations.
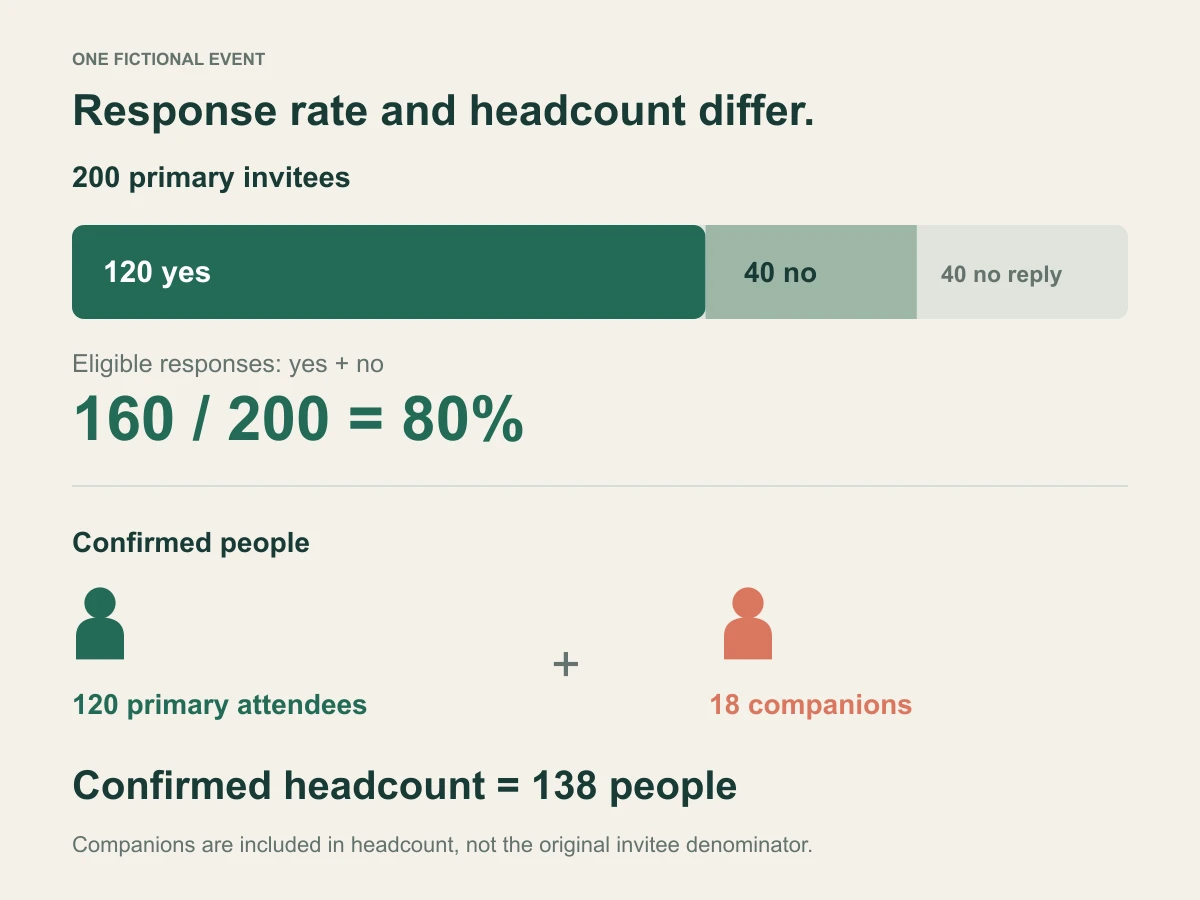
In a fictional example, 200 people are invited. There are 120 yes responses, 40 no responses and 40 unanswered invitations. The response rate is 160 divided by 200, or 80 percent. The yes rate among invitees is 60 percent.
These answer different questions. An organiser can achieve a high response rate while having fewer confirmed guests than hoped. A decline still improves planning accuracy.
Confirmed headcount including companions
Confirmed headcount = confirmed primary attendees plus confirmed companions.
Using the same fictional event, suppose 120 invitees confirm and bring 18 confirmed companions. The headcount is 138. Keep that operational number separate from the 120 primary yes responses used in the invitation calculation.
InviApp's RSVP and guest list tools include companions in confirmed attendee totals. Check the field definitions in your export so you do not add them to a total that already includes them.
If a supplier needs meals rather than people, reconcile meal participation separately. A person attending an afternoon session may not be staying for dinner.
Outstanding invitations and decision risk
Outstanding invitations are invited people who have not yet submitted the response you need. Report the number and the time remaining before the deadline.
For operations, the important question is how uncertainty affects a commitment. Twenty unanswered invitations may be manageable for a flexible networking reception but significant for a small dinner with prepaid places.
Review important unanswered groups through an approved process rather than repeatedly sending every invitee the same message. Use these corporate RSVP reminder templates to distinguish response requests from arrival messages.
Registration timing and reminder effects
An RSVP timeline shows when responses arrive. Compare it with invitation sends, reminders and important programme announcements. A rise after a message is useful context, but it does not by itself prove that the message caused every new response.
Use consistent reporting windows. If one reminder is assessed over 24 hours and another over a week, the totals are not directly comparable. Note differences in audience, lead time and event relevance.
InviApp's analytics and exports include an RSVP timeline, page views, sessions and referrers. Use those observations to improve the next communication plan without inventing a universal best send time.
Page visits and registration conversion
For open registration, one possible metric is completed registrations divided by eligible event-page sessions over the same period. Label it “registrations per session” if that is the denominator you use, rather than implying it measures unique people's completion behaviour.
For example, 90 registrations divided by 600 measured sessions is 15 percent. It does not prove that 15 percent of unique visitors registered. People can return several times, and the registrations and sessions may not map one to one.
Google Analytics defines a session as a period of interaction and documents its own session behaviour. Other systems can count differently. Do not assume that InviApp and a separate analytics tool must produce identical figures.
Keep invited response rates and public-page conversion measures separate. They use different populations and answer different questions.
Capacity and waitlist demand
Capacity utilisation = confirmed people who count against the limit divided by available attendee capacity, multiplied by 100.
For a fictional event with 138 confirmed people and 150 attendee places, utilisation is 92 percent. Check that both numbers include the same categories. Reserved seats or staff places can change what the denominator should be.
Report waitlisted people separately. A waiting list shows additional interest under the current conditions; it does not prove demand for another date. If claim links have been sent but not accepted, distinguish pending offers from confirmed places.
Actual attendance and no shows
Attendance rate = observed attendees divided by confirmed expected attendees, multiplied by 100, using a defined cutoff for the confirmed list.
If 124 of 138 confirmed people are recorded arriving, the attendance rate is about 89.9 percent. The complementary non-attendance share is about 10.1 percent only if the data is complete and both measures use the same population.
Late cancellations, incomplete arrival records and people entering through another door can distort the result. Describe how attendance was recorded before reporting a precise no-show rate.
A confirmed RSVP is not an arrival record. If your event does not have a verified check-in process, report registrations and describe the attendance limitation. Do not infer attendance from page views or the presence of a QR code alone.
Keep business outcomes separate from activity
A customer event may aim to start useful conversations, support existing accounts or generate follow-up meetings. Define those outcomes with the responsible team and collect the evidence through its normal tools.
Registration does not establish purchase intent. A sponsor logo view does not establish a sales opportunity. Event cost divided by registrations is cost per registration, not return on investment.
InviApp supports event-page analytics and attendee exports. Do not assume those exports create automatic CRM attribution or revenue reporting. Verify integrations and join data only through an agreed process when your team needs a broader outcome report.
Build a short report people can use
Include the event purpose, reporting period, audience, metric definitions and the data source. Show the handful of numbers that support a decision, then explain the operational consequence.
For example: “There are 138 confirmed people against 150 available places. Forty primary invitees have not answered. Operations will resolve outstanding invitations before confirming catering on [date].” That is more actionable than presenting page views without context.
Record what you will change for the next event and why. Keep the evidence and the interpretation distinguishable.
Frequently asked questions
What is a good corporate event response rate
It depends on the audience, whether attendance is expected, the event purpose and the invitation window. Start with comparable events from your own organisation and use consistent definitions rather than unrelated benchmarks.
Is an RSVP the same as attendance
No. An RSVP is a response or confirmation before the event. Actual attendance requires an observation or reliable arrival record.
Can page views prove event success
Page views show page activity under the tool's definition. They cannot by themselves establish confirmed attendance, audience quality or commercial results.
Start with a reportable event process
Define the measures before invitations go out, then make sure the data supports them. Explore InviApp Business for a branded event page with registrations, RSVP timelines and exportable attendee information.